
Climate & Cities
Flood maps describe the rain we used to get
Risk maps are built from historical records and assumed drainage performance. Both of those assumptions are moving.
Everything here earned its place by changing an outcome. Nothing about flood risk mapping is included to round the number up.
What matters most
- Return period language describes annual probability, not a schedule.
- Surface water flooding is mapped less reliably than river and coastal flooding.
- Maps assume drainage systems perform as designed, which ageing systems may not.
Return periods are probabilities, not intervals
A hundred-year flood means an event with roughly a one per cent chance of occurring in any given year, not one that arrives on a schedule. Two such events in successive years are unlikely and entirely possible, and the public framing invites the opposite conclusion.
Over a thirty-year mortgage, the cumulative probability of at least one such event is considerably higher than the annual figure suggests. This misunderstanding shapes how seriously people take a designation on a map.
The record base is short and shifting
Flood frequency estimates are derived from rainfall and flow records that in most places span decades rather than centuries. Statistical methods extrapolate from that record to estimate rare events, which is inherently uncertain at the tail.
A changing climate makes the historical record a weaker guide to the future, and adjustment factors applied to account for this vary between countries and are revised periodically. Maps are therefore best read as current best estimates rather than as measurements.
Surface water flooding is the badly mapped one
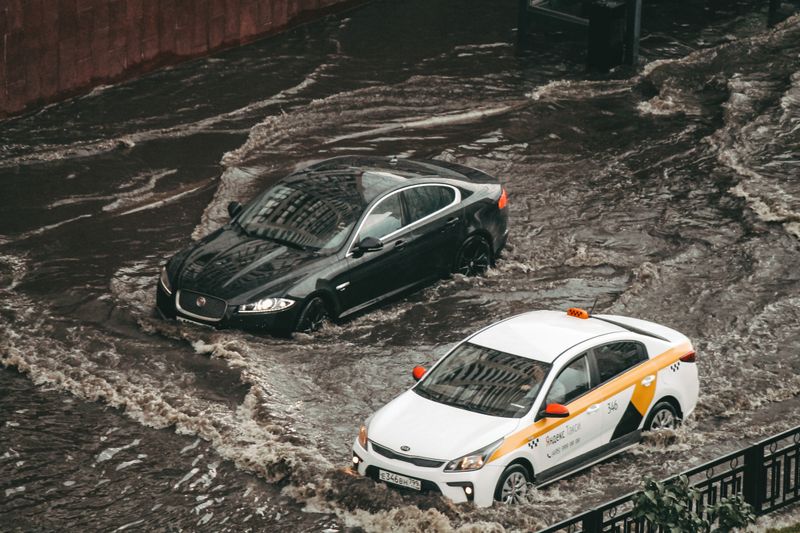
River and coastal flooding follow identifiable channels and are modelled comparatively well. Surface water flooding happens where intense rainfall exceeds drainage capacity, which can be almost anywhere with the wrong topography.
Over a decade, modelling it requires fine topographic data, drainage network records and rainfall assumptions, and the drainage records are frequently incomplete. A large share of properties flooded in recent urban events were not identified as at risk from rivers or the sea.
Maps assume the drains work
Flood models generally assume the sewer and drainage network performs to its design capacity. Real networks are partly blocked, partly collapsed, connected to things they should not be, and sized for a smaller catchment than they now serve. Where actual performance is below design, real flood extents exceed mapped ones systematically.
Asset condition surveys are expensive and are the missing input in most surface water modelling.
Development changes the map after it is drawn
Paving over permeable ground upstream increases runoff into the same drainage system, altering risk for properties downstream. Requirements for new development to manage runoff on site exist in many jurisdictions and vary in stringency and enforcement. Incremental changes — driveways, extensions, garden paving — accumulate without any individual approval process capturing them.
Measured properly, several countries have introduced controls on paving front gardens for precisely this reason.
The data here is patchy — most cities do not publish it consistently.
What to do with a flood map
Treat a designation as a prompt to investigate rather than as a verdict, and look at surface water layers as well as river and coastal ones. Ask what the map assumes about defences, because a defended area carries residual risk that is often larger than the mapped one suggests. Property-level measures — barriers, non-return valves, resilient internal finishes — reduce damage where risk cannot be eliminated.
Across a network, insurance availability and arrangements for high-risk properties differ enormously between countries and are worth checking early.
Everything above, in order of what to do first
- Return periods are probabilities, not intervals. A hundred-year flood means an event with roughly a one per cent chance of occurring in any given year, not one that arrives on a schedule.
- The record base is short and shifting. Flood frequency estimates are derived from rainfall and flow records that in most places span decades rather than centuries.
- Surface water flooding is the badly mapped one. River and coastal flooding follow identifiable channels and are modelled comparatively well.
- Maps assume the drains work. Flood models generally assume the sewer and drainage network performs to its design capacity.
- Development changes the map after it is drawn. Paving over permeable ground upstream increases runoff into the same drainage system, altering risk for properties downstream.
- What to do with a flood map. Treat a designation as a prompt to investigate rather than as a verdict, and look at surface water layers as well as river and coastal ones.
The takeaway
Read the map as an estimate built from the past. The rain is not consulting it.
Cities are built by a thousand small permissions, not one big plan.
Questions readers ask
What does a one in a hundred year flood mean?
An event with roughly a one per cent chance of occurring in any given year. It is a probability, not a frequency, and such events can occur in consecutive years.
Why do properties flood that are not on flood maps?
Most commonly surface water flooding, which is harder to model and depends on drainage capacity and local topography. Many flooded properties in recent urban events were outside mapped river and coastal zones.


